MAIN FEATURES
FLEXIBLE SOFTWARE CONFIGURATION
FLIM STUDIO offers a seamless and powerful user experience. With the flexibility to configure in two distinct modes, Wizard and Custom, FLIM STUDIO caters to a spectrum of user preferences..
WIZARD
This mode incorporates a graphical representation of the settings being configured and a step-by-step process that allows the user to enjoy a guided and simplified experience, streamlining the setup for quick and efficient utilization.
ADVANCED
Unlock the full potential of FLIM STUDIO with a comprehensive range of customization options. Tailor the software to your specific needs, allowing for a nuanced and intricate approach to fluorescence lifetime experiments.
Advanced mode provides users with the ability to fine-tune and set additional parameters, offering an expanded suite of options for those who require more intricate adjustments and a heightened level of control over their experiments.
WIZARD
This mode incorporates a graphical representation of the settings being configured and a step-by-step process that allows the user to enjoy a guided and simplified experience, streamlining the setup for quick and efficient utilization.
ADVANCED
Unlock the full potential of FLIM STUDIO with a comprehensive range of customization options. Advanced mode provides users with the ability to fine-tune and set additional parameters, offering an expanded suite of options for those who require more intricate adjustments and a heightened level of control over their experiments.
SOFTWARE SETTINGS
In both Wizard Mode and Advanced Mode, you will be prompted to set the following parameters.
- Device: Select the FLIM LABS Data Acquisition card connected to your PC.
- Type of experiments: Choose whether to perform an imaging or spectroscopy experiment.
- SYNC IN: Specify whether you will use a USB cable or SMA to connect to the Sync In port. The Sync In port is responsible for accepting the input signal from the laser.
- SYNC OUT: Specify whether you will use a USB cable or SMA to connect to the Sync out port. The Sync out port is responsible for activating and modulating a laser source.
- Channel (from 1 to 8):Indicate the number of channels to be utilized for fluorescence sampling and choose the connection method – either USB cable or SMA – for that channel.
Utilizing data from either the frame/scan clock independently or in conjunction with the line clock, the software adjusts accordingly.
- Pixel/Line/Frame: Specify whether you will use a USB cable or SMA to connect on these doors
- Pixell dwell time: Specify in microseconds the exposure time of each pixel to the scanner.
- Harmonic content (Only in Advanced mode): Setting the harmonic content value will enable you to find the right balance between resolution and accuracy in your measurements. By increasing the Harmonic content value, you can enhance the resolution of your experiments, measuring even the shortest fluorescence lifetimes.
This field is configured during the Reference phase, and the value set at this stage will serve as a constant reference throughout the Scouting and Data phases, remaining unchanged.
- Pixel size: Specify the size of each pixel in micrometers.
- Box width/height: Specify the width/height of the frame to scan.
- Number of pixel on x/y line: Set the same value as made in Box width/Box height.
- Offsets: Specify the offset from the edges of the box from which to extract the images.
CALIBRATION GUIDED PROCESS
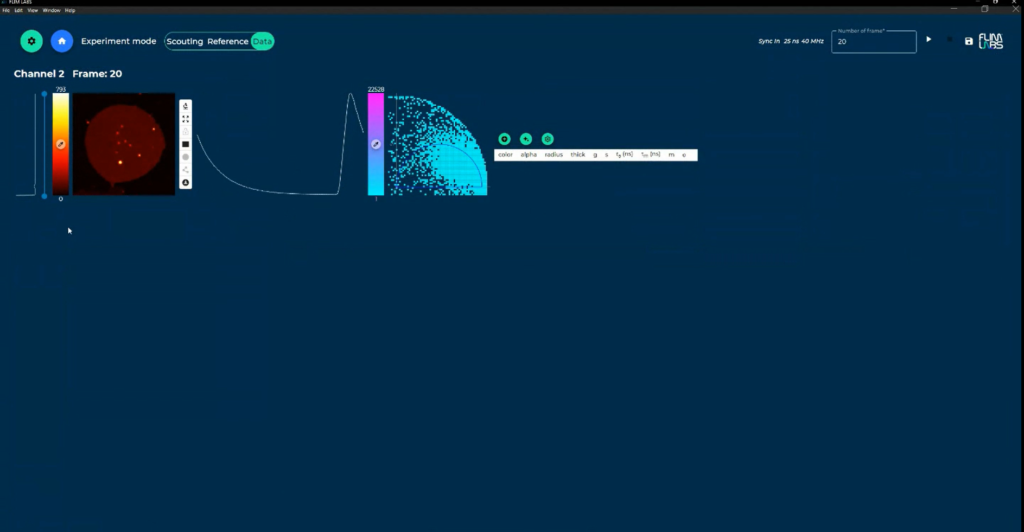
FLIM STUDIO introduces three operational modes for imaging experiments, providing a systematic approach to fine-tune experiments and initiate data acquisition with confidence in optimal calibration.
The consecutive modes, namely REFERENCE, SCOUTING, and DATA, guide the user through a comprehensive process, ensuring that all parameters are finely calibrated for the most effective execution of the experiment.
SCOUTING
The SCOUTING function lets you examine your sample by capturing images, assisting in the process of navigating across it to identify your target area (ROI).
This mode can be utilized both before and after the software has been calibrated.
REFERENCE
Calibrate FLIM STUDIO, it is essential to initiate measurements on a sample with a known fluorescence lifetime.
By starting the acquisition on the sample and providing FLIM STUDIO with the fluorescence lifetime value, the software automatically calibrates itself, ensuring that all subsequent measurements are carried out with the utmost accuracy.
DATA
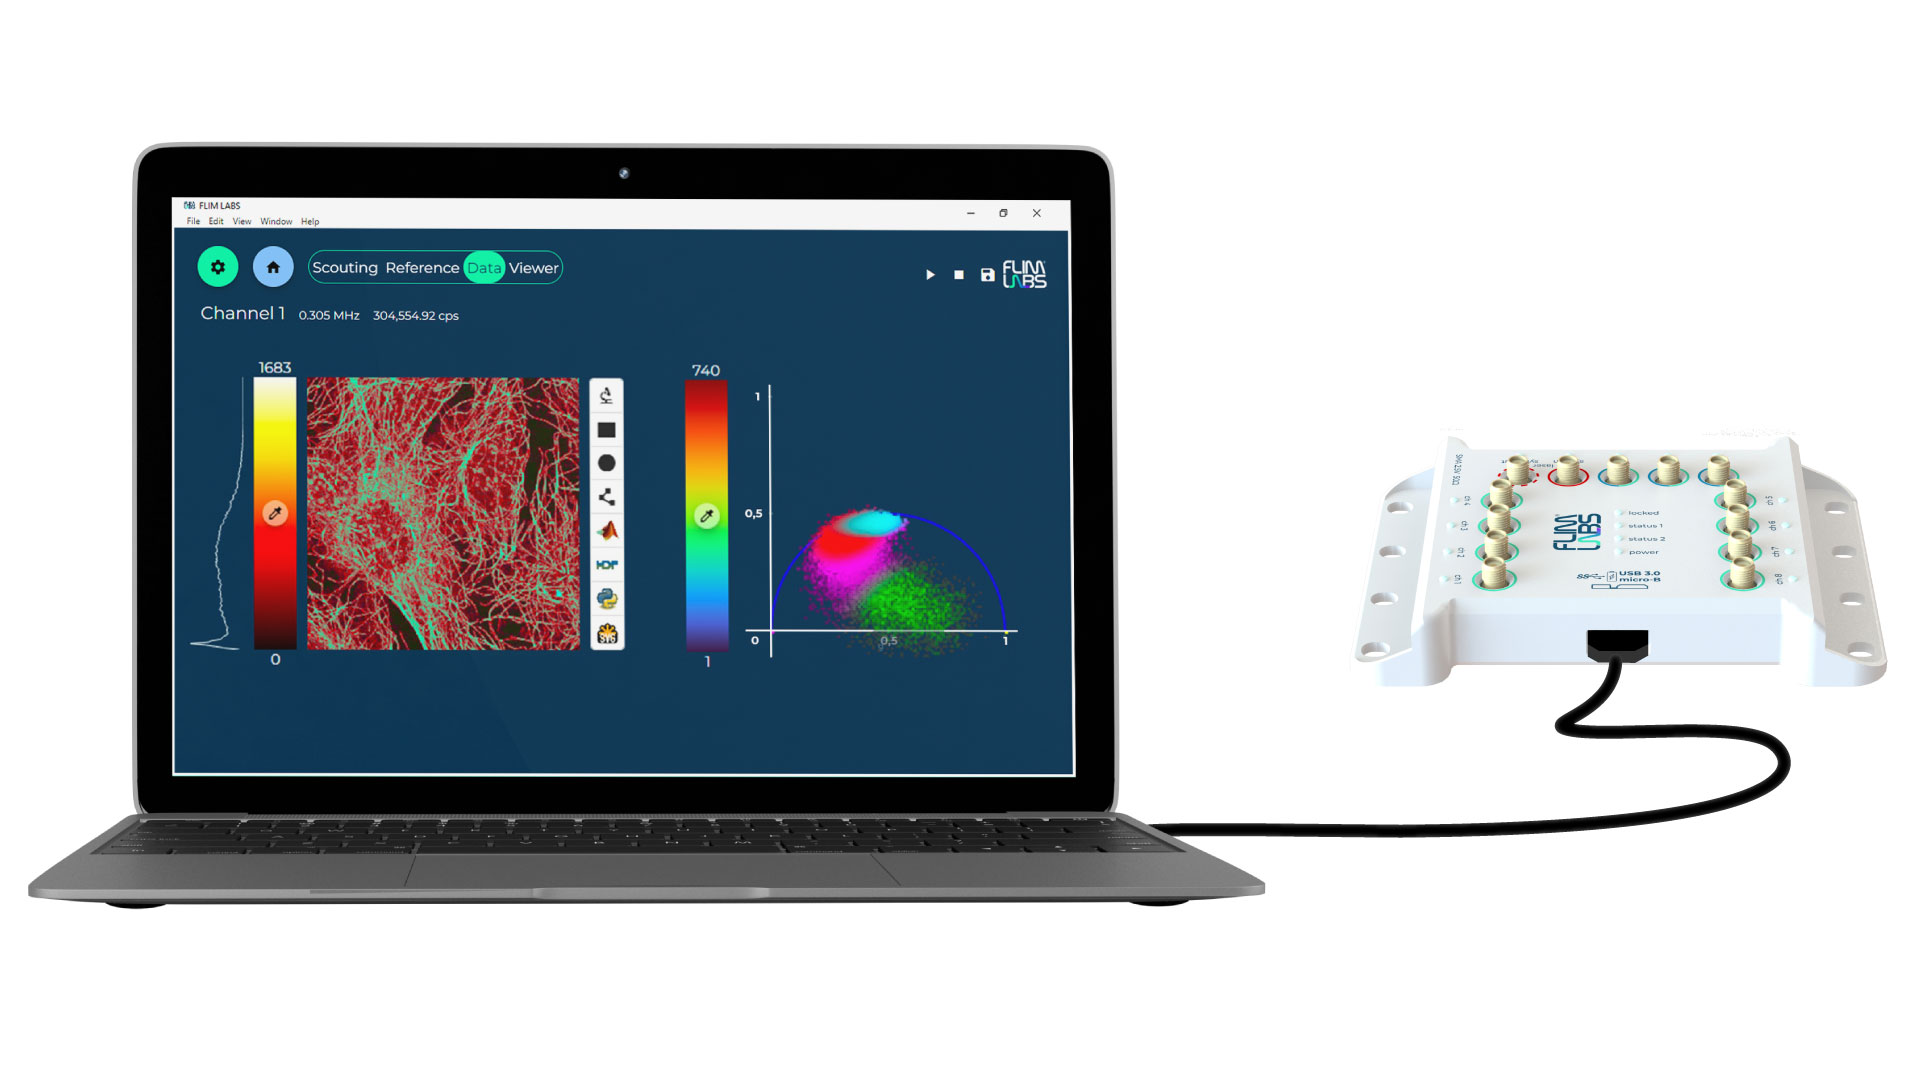
Once you have identified the region of interest (ROI) through the Scouting mode, you can effectively commence the imaging experiment by acquiring data from your sample. Subsequently, you can analyze the acquired data and extract the most valuable insights with FLIM STUDIO, using FLIM Phasors approach.
Data exporting
Once data has been analyzed, FLIM Studio allows you to export your experiments in the format that best suits your needs. At the moment, the available formats are: MatLab (.mat), Python (.npz), HDF5 (.hdf), .SVG (.svg) for both FLIM-phasor and imaging data. The exported data can be locally stored in your computer and quickly shared with other people by using our social-media instant sharing tools.
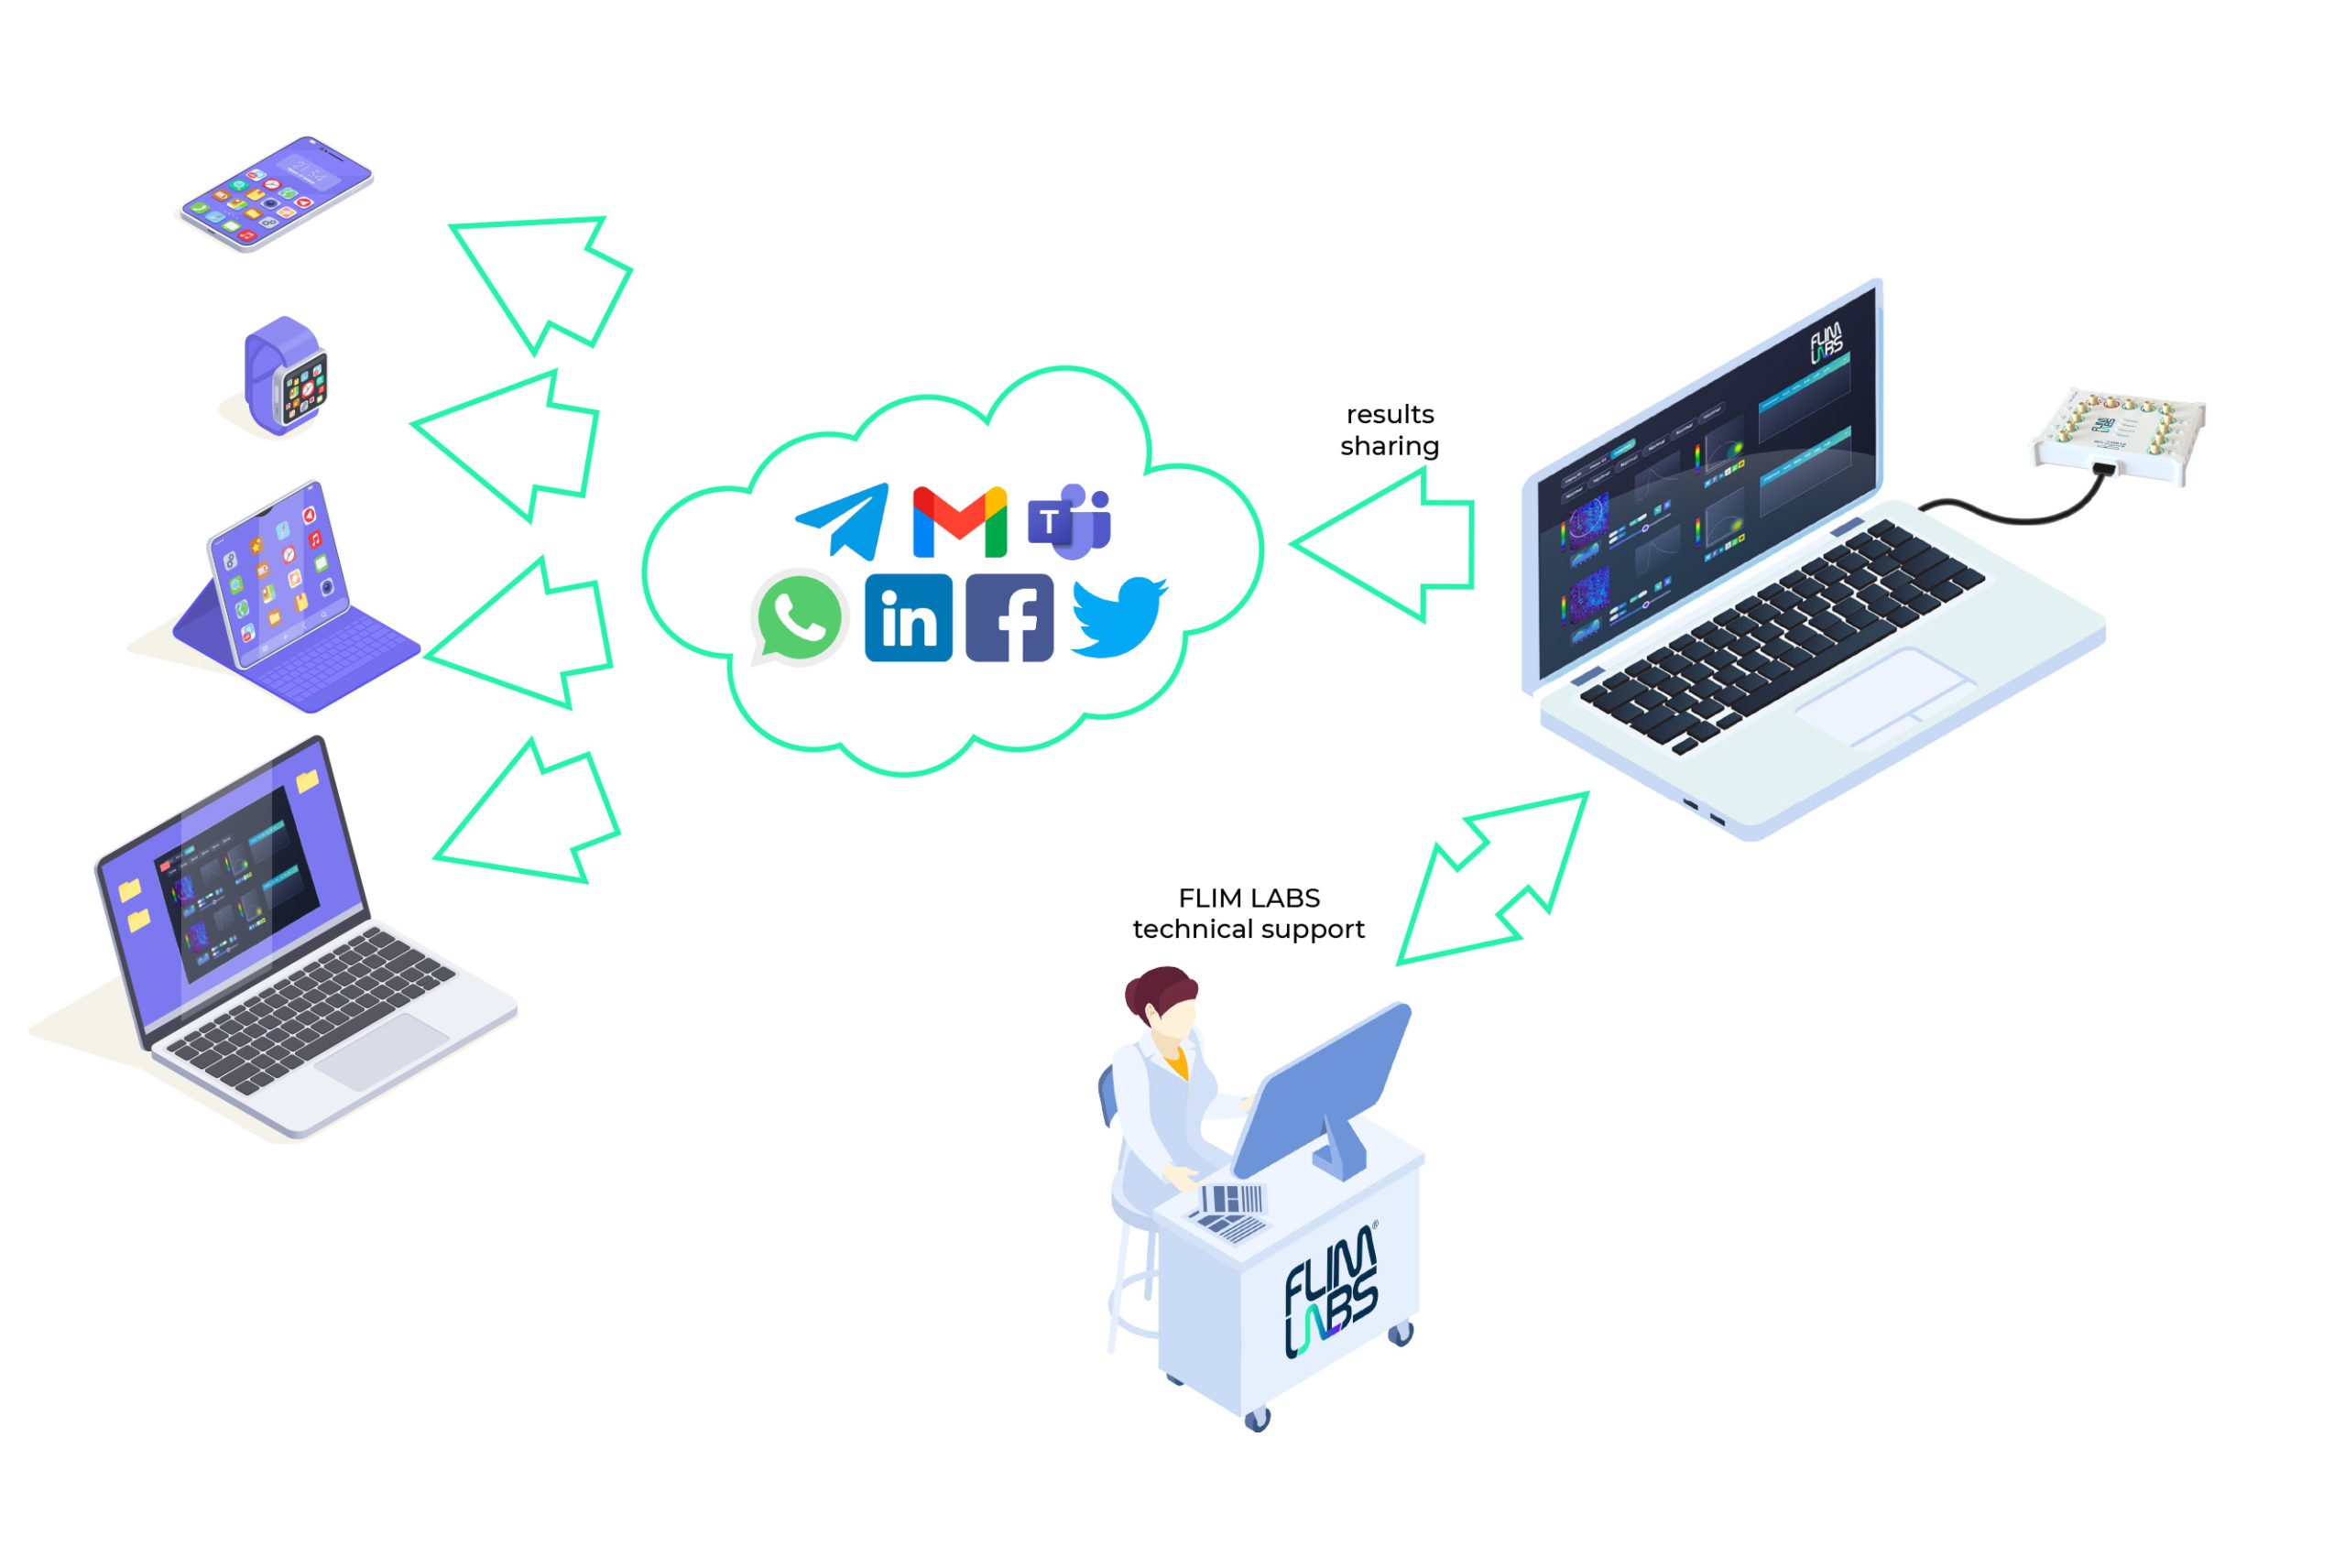
Social media result sharing
Available as optional package
FLIM LABS mission is to make FLIM technology and analysis easy and accessible: we want to help building a strong and solid FLIM users community. For this reason, we have created a social-media share package that can be used to instantly share their results via iweb messaging apps (WhatsApp, Telegram), email, or social-media (Linkedin, Twitter). This tool will prove to be useful for sharing results within the team, the online scientific community and/or for seeking tech-help.
In cloud storage
Available as optional package
FLIM LABS mission is to make FLIM technology and analysis easy and accessible: we want to help building a strong and solid FLIM users community. For this reason, we have created a social-media share package that can be used to instantly share their results via iweb messaging apps (WhatsApp, Telegram), email, or social-media (Linkedin, Twitter). This tool will prove to be useful for sharing results within the team, the online scientific community and/or for seeking tech-help.
GIT
FLIM Studio is developed using GIT technologies ( ) to keep track of changes and new features implementation. FLIM LABS is committed to supporting and developing FLIM Studio maintenance and new releases.
Real time imaging capability
Our compact and light-weight FLIM Data Acquisition Card can sustain a continuous stream of data to the software, allowing for real-time imaging reconstruction analysis. Thanks to a simplified visual interface, users can swiftly access the desired parameters without encountering redundant configurations. FLIM LABS always offers prompt customer support in case of need.
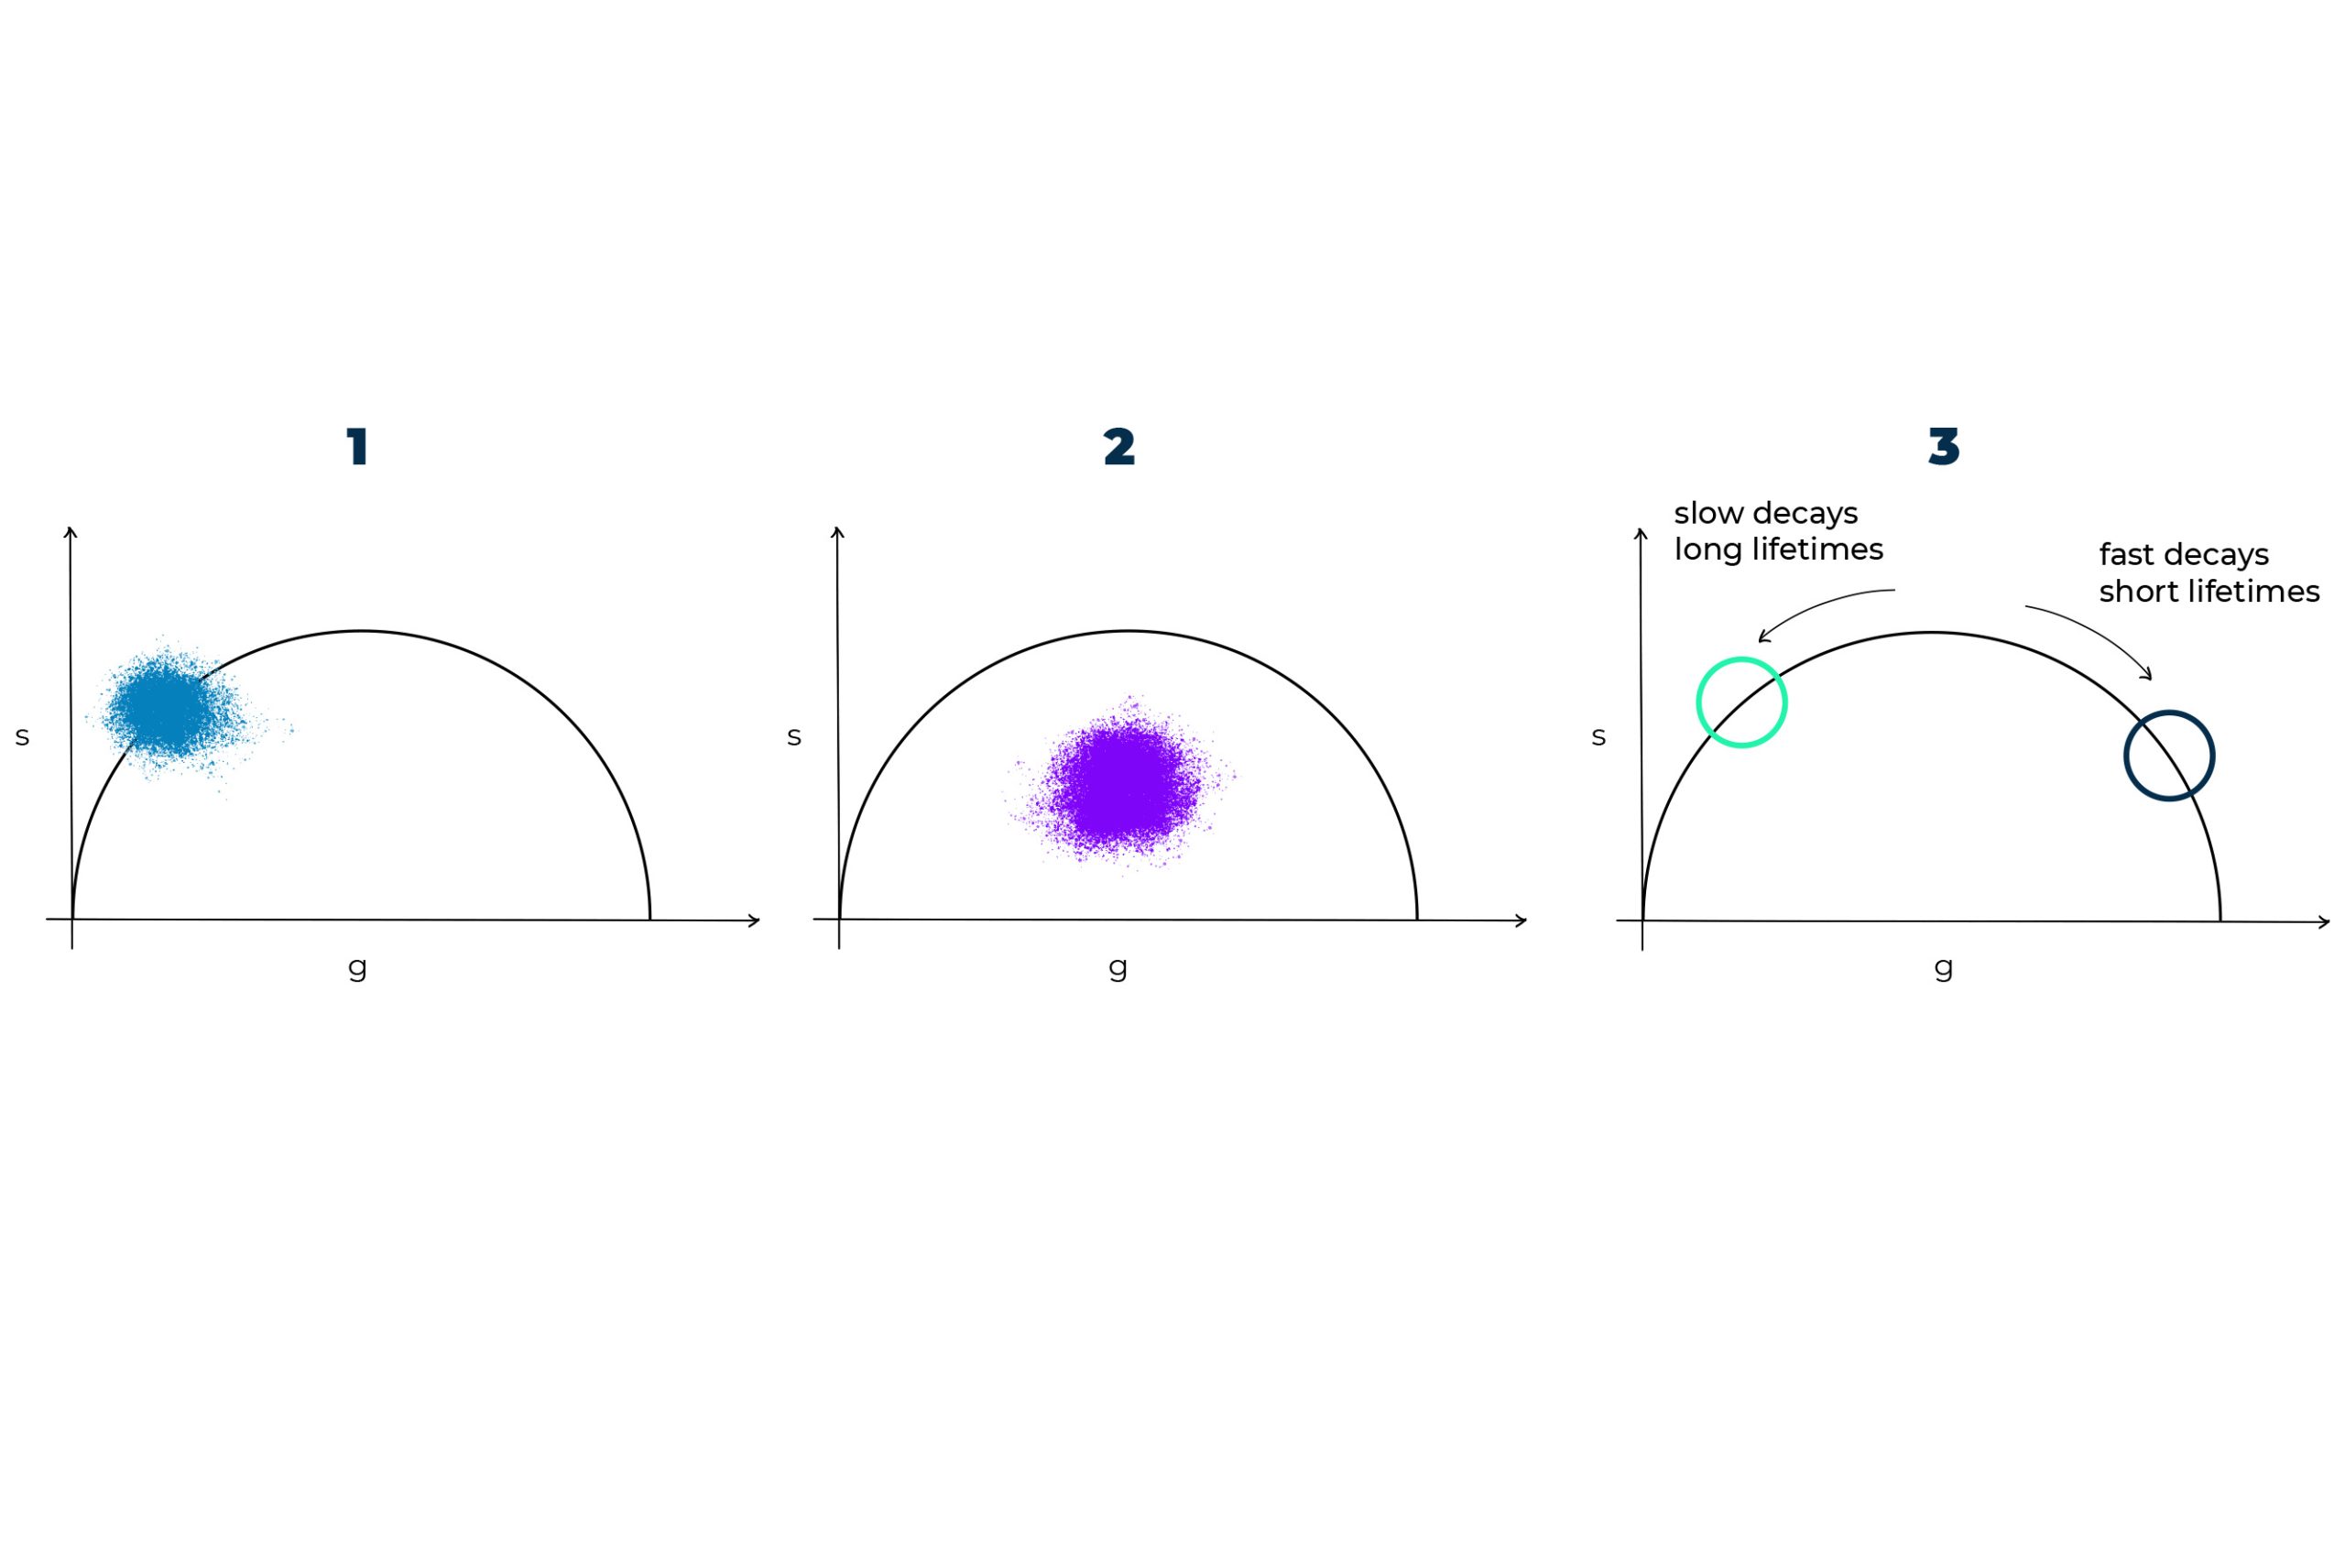
Real time FLIM phasor-plot
The lag-free process from the data detection, acquisition to reconstruction enables real-time FLIM analysis using a phasor-plot approach. The intuitiveness of the phasor-plot analysis lies in its geometrical working principle, which can be summarized using three simple rules: (1) if a cloud of points falls on the semicircle, the fluorescence signal can be described by a single exponential lifetime decay; (2) anything that falls within the semicircle area is a superposition of different fluorescence lifetime values (3) shorter lifetimes progressively distribute along the semicircle in a clockwise manner.
Phasor plot analysis
Our phasor-plot analysis provides users the flexibility to choose the appropriate phasor segmentation technique, either by performing simple coloring of the phasor cloud or by applying a color gradient to the entire phasor cloud, highlighting either the phase or the modulation lifetime response. Alternatively, it would be possible to use the entangled circlet options in which a color gradient is stretched across two circlets. For non-experienced users it is also possible to rely on our automated machine learning algorithm, exploiting a GMM (Gaussian Mixture Module) approach which will automatically identify phasor clusters (assigning them colors and ultimately coloring the FLIM image).
- Circlet
- Entangled circlets
- Phase and modulation gradient background
- automatic GMM (Gaussian Mixture Model) – available as optional package
Composite FLIM images
In our software FLIM STUDIO, users can visualize the superposition of different lifetime intensity in the FLIM image with unprecedented data rendering and visualization. Different fluorescence lifetime decays can be simultaneously visualized together with local pixel intensity information. This ensures an intuitive representation of the experimental data.
Region of interest (ROI)
Starting from your acquired image, you can draw various ROI shapes, including custom outlines to extract the desired details and visualize a particular feature or area in your sample. In this way, you can extract the fluorescence lifetime decay from the selected ROI only and build the corresponding phasor-plot for assessing your experimental results.
B2C B2B Bespoke design
For any type of software integration or custom development any part of our software can be customized, as we code routines ourselves. If you need to integrate or develop additional functions, do not hesitate to contact us. We will be happy to tune the software on your needs.


