Home › Methods › Phasor analysis

Methods

Phasor Analysis of fluorescence lifetime

A graphical, fit-free way to read lifetime data.

The phasor approach turns the fluorescence decay of every pixel into a single point on a 2D plot, without fitting exponential models.

Pixels with similar decays cluster together, so different lifetime populations, mixtures and FRET can be recognised at a glance and mapped back onto the image. FLIM LABS uses phasors as its primary approach to lifetime analysis.

From intensity to lifetime: each pixel becomes a point on the phasor plot, and cursors on the plot select lifetime populations that color the FLIM image. Schematic.

01 Phasor

What is a phasor?

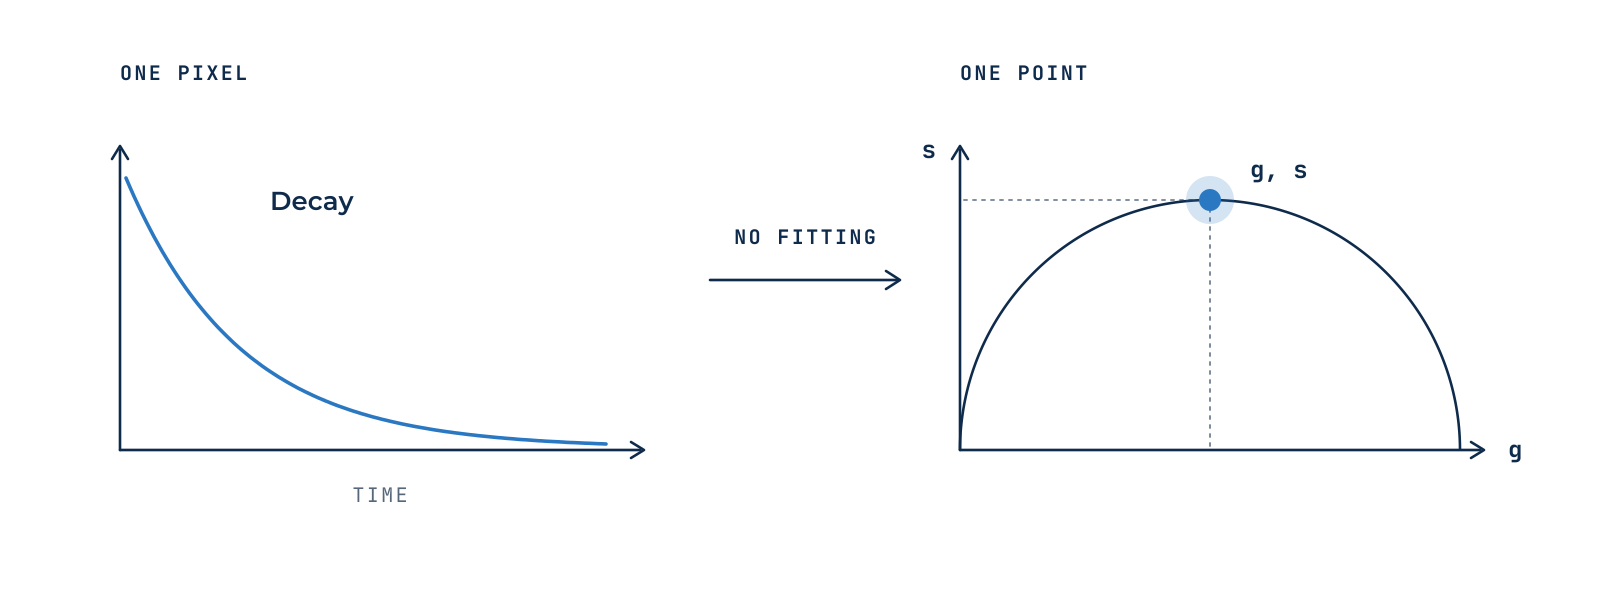
Each pixel’s decay is transformed into two coordinates, g and s, using cosine and sine transforms at the laser repetition frequency. Together they define one point, the phasor, on the phasor plot.

No decay model has to be chosen in advance, and the transform is instantaneous, even for images with hundreds of thousands of pixels. The plot is calibrated with a reference dye of known lifetime.

Figure 1 · The decay recorded in a pixel becomes a single point on the phasor plot.

02 Reading the plot

How to read the phasor plot

Each molecular species has its own position, a lifetime fingerprint, so species can be identified by where they fall.

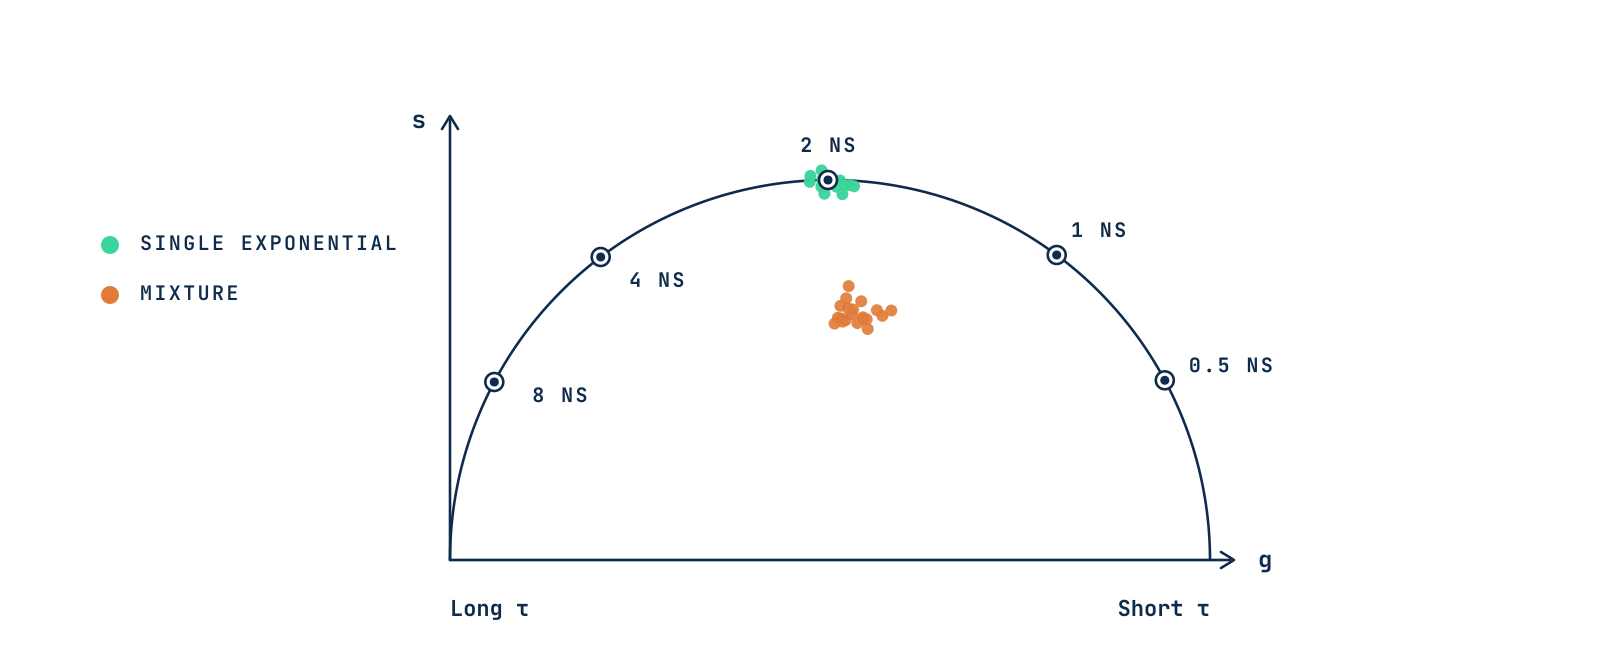
Figure 2 · Lifetimes along the universal semicircle (80 MHz). Mixtures fall inside it.

01

Universal semicircle

Every single-exponential decay lies on a semicircle, so a point there corresponds to a single lifetime.

02

Long to short

Long lifetimes sit on the left, short lifetimes on the right.

03

Inside the circle

Points inside the semicircle come from a mixture of lifetimes or a complex decay.

03 Mixtures

Mixtures add linearly

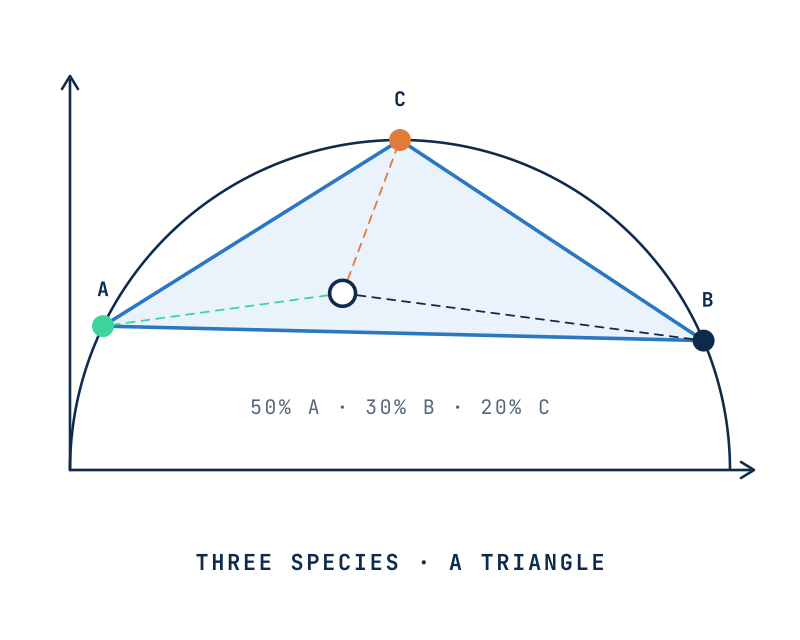
Phasors add like vectors. Pixels containing two species lie on the straight line joining their phasors, and their position along it gives the fraction of each. Three species fill a triangle.

Processes that change the lifetime itself follow curved paths instead. FRET, for example, moves the donor along a calculated trajectory, which is how phasors quantify FRET efficiency.

Read the FLIM-FRET method

Two species lie on a straight line on the phasor plot

Figure 3 · The position along the line between two species gives their relative fractions, calculated graphically.

Three species fill a triangle on the phasor plot

Figure 3 · Two species lie on a line, three fill a triangle. The closer a pixel is to a corner, the larger that species’ fraction. In a liposomal formulation, for example, the corners can be free, crystalline and membrane-bound drug.

04 Reciprocity

From the plot back to the image

Every point on the phasor plot is linked to a pixel in the image. Selecting a cluster with a cursor highlights exactly where that lifetime population is found, which makes segmentation by lifetime simple and visual, from manual cursors to machine-learning clustering.

Figure 4 · Cultured cells, schematic. The intensity image shows where the signal is; on the phasor plot, three cursors select the lifetime populations of mitochondria (τ1), cytoplasm (τ2) and nuclei (τ3), which color the FLIM image pixel by pixel.

05 Applications

What are phasors used for?

01

Separating fluorophores and autofluorescence

Species with overlapping spectra but different lifetimes.

02

FRET and biosensors

Fraction of interacting molecules and FRET efficiency in each pixel.

03

Label-free metabolism

Free and protein-bound NAD(P)H mapped in living cells and tissues.

Precision depends on photon counts

A few hundred photons can already give a reliable phasor, and background should be measured separately.

Further reading

References

1Digman MA, Caiolfa VR, Zamai M, Gratton E. The phasor approach to fluorescence lifetime imaging analysis. Biophysical Journal. 2008;94(2):L14–L16. doi:10.1529/biophysj.107.120154

2Digman MA, Gratton E. The phasor approach to fluorescence lifetime imaging: exploiting phasor linear properties. 2012. escholarship.org/uc/item/5g279175

3Hinde E, Digman MA, Welch C, Hahn KM, Gratton E. Biosensor Förster resonance energy transfer detection by the phasor approach to fluorescence lifetime imaging microscopy. Microscopy Research and Technique. 2012;75(3):271–281. doi:10.1002/jemt.21054

4Vallmitjana A, Torrado B, Gratton E. Phasor-based image segmentation: machine learning clustering techniques. Biomedical Optics Express. 2021;12(6):3410–3422. doi:10.1364/BOE.422766

5Coucke Q, Parveen N, Solís Fernández G, et al. Particle-based phasor-FLIM-FRET resolves protein-protein interactions inside single viral particles. Biophysical Reports. 2023;3:100122. doi:10.1016/j.bpr.2023.100122

From principle to analysis

Phasor analysis software

Acquire lifetime data with FLIM IMAGER and explore it on the phasor plot, or analyze it in GSLab, an open web app for phasor analysis and segmentation, with cursors that map lifetime populations back onto the image.